To measure the success of your predictive analytics efforts, you need to track the right Key Performance Indicators (KPIs) that align with your business objectives.
Think accuracy, precision, recall, and return on investment (ROI) – these metrics guarantee your models are driving real business value and informing data-driven decision-making.
Don’t just focus on vanity metrics; instead, tie your KPIs to actual business impact, like on-time project delivery, financial returns, and customer satisfaction.
By doing so, you’ll be able to refine your predictive models, optimize resources, and make informed decisions.
Want to access the full potential of your predictive analytics?
Why are KPIs important for predicitve analytics
When you’re building a predictive analytics model, setting clear key performance indicators (KPIs) is essential.
You need to define what success means for your business and translate it into measurable quantities.
KPIs help you evaluate model performance in business-relevant terms, tying model outputs to actual business impact. This way, you can focus on what matters most to your business and avoid getting distracted by “vanity metrics” that don’t drive real results.
KPI 1: Predict On-time project delivery with historical data analysis
Your predictive analytics model is only as good as the business outcomes it drives, and one key outcome is on-time project delivery.
To optimize this metric, you need to leverage analytics to identify patterns and correlations in your historical project data.
Collect data on project delivery times, including factors that may have impacted on-time delivery, and use machine learning algorithms to analyze it.
Develop predictive models that can forecast the likelihood of on-time delivery for new projects based on their characteristics.
Then, use these predictions to proactively address potential delays on high-risk projects.
By doing so, you’ll be able to deliver projects on time, every time, and make a tangible business impact.
Make on-time project delivery a key performance metric and watch your predictive analytics model drive real results.
KPI 2: Key Performance Indicator to measure the business impact of models/insights
You’re now ready to gauge the real impact of your predictive analytics models and insights on your business.
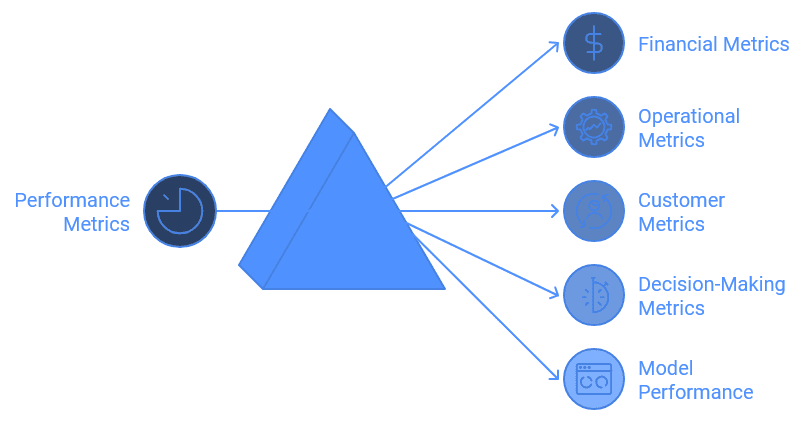
You’ll want to track financial metrics, like revenue growth and cost savings, as well as operational metrics, such as process efficiency and productivity gains.
But don’t forget to also measure customer-related metrics, decision-making metrics, and model performance metrics – these will give you a more complete picture of your models’ effectiveness.
Financial Metrics
Releasing the true value of predictive analytics requires a deep understanding of its financial implications.
You need to track the right financial metrics to measure the success of your predictive models.
So, which key performance indicators (KPIs) should you be watching? Start with revenue impact – are your predictive insights leading to increased sales?
Then, look at cost savings – are you streamlining processes and reducing waste?
Finally, calculate your return on investment (ROI) to guarantee your predictive analytics efforts are paying off.
Add these metrics to your data analytics dashboard to get a clear picture of your predictive analytics’ financial impact.
By monitoring these financial metrics, you’ll be able to refine your prediction models and make data-driven decisions that drive real business results.
Operational Metrics
Measuring the operational impact of predictive analytics is essential for understanding its business value.
You need to know how your models and insights are affecting your day-to-day operations.
Start by tracking efficiency improvements, such as reductions in processing times or inventory levels. Are your resources being used more effectively?
Look at how human, material, and financial resources are being allocated and used.
You should also quantify decreases in errors or defects in processes. This will give you a clear picture of how predictive analytics is improving your operations.
By measuring these operational metrics, you’ll be able to identify areas where you can make further improvements and optimize your business processes. This will help you maximize the business impact of your predictive analytics efforts.
Customer-Related Metrics
Numerous predictive analytics initiatives focus on improving customer outcomes, and for good reason: even small improvements in customer retention, lifetime value, and satisfaction can have a significant impact on your bottom line.
To measure the success of these initiatives, you need to track key customer-related metrics. Start by monitoring customer retention rates – are you keeping more customers than you’re losing?
Next, track increases in predicted and actual customer lifetime value. Are your customers spending more over time? Finally, keep an eye on customer satisfaction scores or Net Promoter Scores.
Are your customers happy with your service? By tracking these metrics, you can see how your predictive analytics initiatives are actually affecting your customers and make adjustments to improve outcomes.
Decision-Making Metrics
Beyond the domain of customer outcomes, predictive analytics also has a profound impact on the way you make business decisions.
You’re likely using predictive insights to inform your choices, but are you measuring their effectiveness? It’s time to start tracking decision-making metrics.
Begin by measuring decision speed – how much time are you saving by leveraging predictive analytics? You should see a reduction in the time it takes to make key business decisions.
Next, focus on decision accuracy. Are your predictions leading to better outcomes? Track improvements in the accuracy of decisions made using predictive insights. By evaluating these metrics, you’ll be able to refine your decision-making process and make more informed choices. This will ultimately lead to increased efficiency and better business results.
Model Performance Metrics
Your predictive models are only as good as the insights they produce, and the business impact they drive.
So, it’s essential to measure their performance using the right metrics. You want to know how accurately your models predict outcomes compared to actual results – that’s where Prediction Accuracy comes in. This metric will tell you if your models are on point or need some fine-tuning.
Another important one is Model Stability, which tracks how well your model’s performance holds up over time. You don’t want a model that’s a one-hit wonder, do you? By keeping an eye on these metrics, you’ll be able to refine your models and guarantee they’re driving real business value.
Remember, it’s all about measuring success and making data-driven decisions.
KPI 3: Model response time
Speed is a critical factor in predictive analytics, and model response time is a key performance indicator that measures how quickly a model can generate predictions when given input data.
You want your model to be fast, but how fast is fast enough? To measure model response time, you’ll need to calculate the average time taken for the model to generate predictions across multiple requests.
You should also measure response times at different percentiles, like the 90th or 95th, to understand performance distribution and identify outliers.
To optimize model response time, consider factors like model complexity, input data size, and hardware resources. Implement logging and monitoring mechanisms to track response times, and use automated testing to simulate various load scenarios.
By regularly monitoring response times, you can detect any degradation over time and make adjustments to guarantee your model meets performance requirements.
KPI 4: Qualitative Data Analytics
When evaluating the performance of predictive analytics models, you can’t rely solely on quantitative metrics like model response time.
You need to take into account the broader business context and user experience through qualitative analysis.
Ask yourself: Does the KPI provide actionable insights that drive business decisions?
Is it aligned with overall business objectives and strategy?
Can stakeholders easily understand what the KPI means?
You should also assess the KPI’s relevance, timeliness, and adoption. Reflect on the data quality, reliability, and potential biases. Evaluate the model’s performance over time and its scalability.
By doing so, you’ll guarantee your KPIs remain relevant and impactful, driving measurable business value. Regular qualitative assessments will help you look beyond just the numbers and make informed decisions.
Conclusion
You’ve made it! Now that you’ve got a handle on the top KPIs for predictive analytics, it’s time to put them to work. Remember, on-time project delivery, business impact, model response time, and qualitative analysis are key to measuring success. Don’t just track them – use them to adjust and improve your strategy. By doing so, you’ll unleash the full potential of predictive analytics and drive real results for your organization. Stay focused, stay driven!